
Amazon TACoS: The Formula, Real Math, and What Yours Should Be Doing
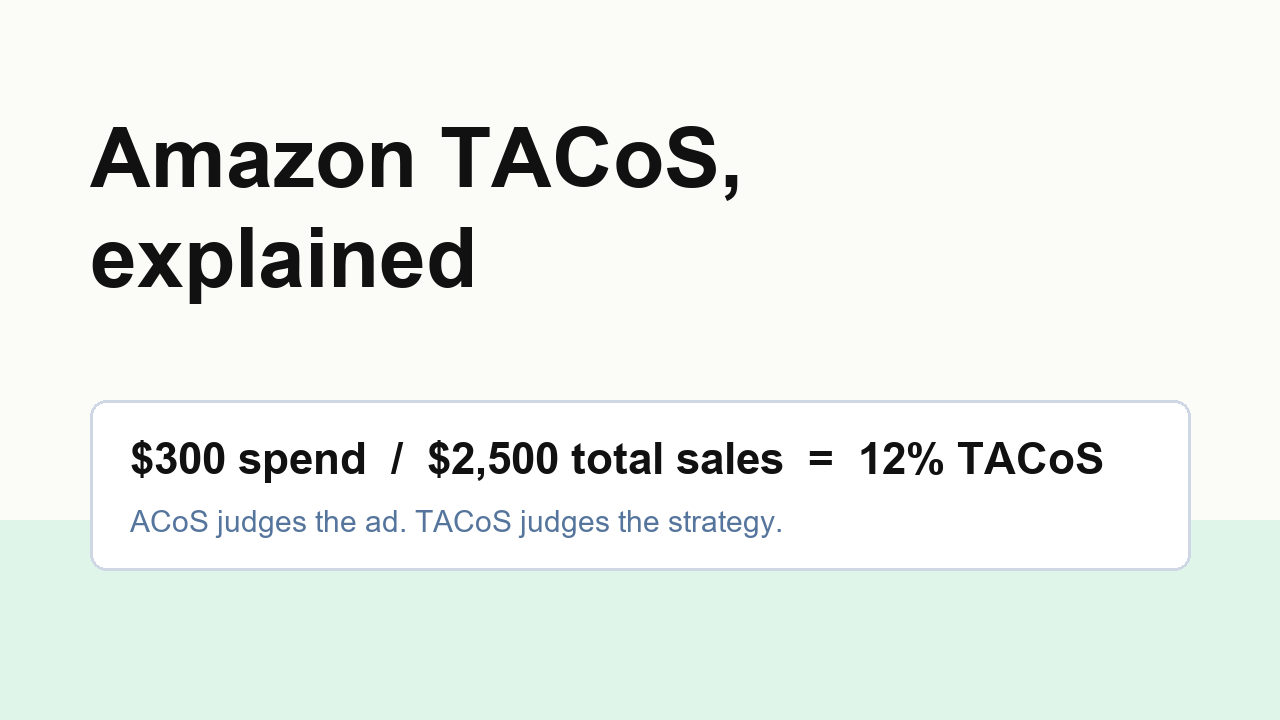
TACoS is your total advertising cost of sales. You calculate it by dividing your ad spend by ALL of your sales, organic orders included, not just the sales your ads get credit for.
$300 ad spend / $2,500 total sales = 12% TACoS
That one change in the denominator makes TACoS answer a different question than ACoS does. ACoS tells you whether your ads are efficient. TACoS tells you whether your business is becoming more or less dependent on them. Most sellers watch the first number obsessively and never look at the second, which is a shame, because the second one is where the strategy lives.
The calculation, step by step
Take any period, say the last 30 days. You need two numbers.
- Total ad spend for the period, straight from campaign manager
- Total sales for the period, every order, whether an ad touched it or not
Divide the first by the second. Say you spent $450 on ads last month, your ads generated $1,500 in attributed sales, and your organic orders brought the month's total revenue to $3,750.
$450 / $1,500 ad sales = 30% ACoS
$450 / $3,750 total sales = 12% TACoS
Same spend, same month, two very different-looking numbers. Both are true. The gap between them is your organic business, and watching how that gap moves is the whole point.
TACoS vs ACoS, and when each one lies to you
ACoS judges the ad in isolation, so it misses what ads do beyond the click. On Amazon, sales velocity feeds keyword rank, and rank feeds organic orders your ads never get credit for. A campaign can look mediocre on ACoS while quietly building an organic base that shows up nowhere in its own numbers.
TACoS has the opposite blind spot. Because organic revenue sits in the denominator, a strong organic month can make even wasteful ad spend look fine. A 10% TACoS with a 90% ACoS just means your ads are lighting money on fire in a room your organic sales keep well lit.
So use them together. ACoS against your breakeven tells you if the ads themselves make money (the math is in our good ACoS guide). TACoS over time tells you if the overall ad strategy is doing its job.
The trend matters more than the number
There's no universal good TACoS for the same reason there's no universal good ACoS. Margins, category, and product age all move it. What you can read reliably is the direction.
A launch looks like this. Month one, $300 of spend against $1,000 of total sales is a 30% TACoS, and that's fine, almost everything is ad-driven because nobody knows the product exists. By month six, the same $300 of spend against $3,000 of total sales is a 10% TACoS. Spend held flat, organic grew underneath it. That falling line is what a working strategy looks like.
The pattern to worry about is the opposite one. A mature product whose TACoS climbs month after month is telling you its organic position is eroding and paid traffic is filling the hole. Nothing about ACoS will flag that, your campaigns can look perfectly efficient the entire time. Check rank on your main keywords, check new competition, and look hard at whether your spend is defending the product or just propping it up.
Flat TACoS with growing sales is a fine place to be too. Spend is scaling with the business, ads and organic are growing together.
Is a lower TACoS always better?
No, and this is the nuance most TACoS content skips. A very low TACoS can mean a healthy organic machine, or it can mean you're under-advertising, coasting on organic position while competitors buy the placements that will eventually erode it. A mature product at 3% TACoS with flat sales might be a candidate for MORE spend, not a trophy.
The number is a dependency gauge, not a score to minimize. What you actually want is a TACoS that's stable or falling while total sales grow. Falling TACoS with falling sales just means the whole product is shrinking, and that's not a win either, which is why the metric only reads correctly next to your revenue trend.
Common TACoS questions, answered short
What's the formula for TACoS?
Total ad spend divided by total sales (organic plus ad-attributed), times 100. $300 spend on $2,500 total sales is 12%.
What's a good TACoS?
Depends on margin and lifecycle, same as ACoS. Launches commonly run 20-30%+ while ads drive most sales. Established products with real organic traction often settle under 10-15%. The trend over months tells you more than any single reading.
TACoS vs ACoS in one line?
ACoS measures ad efficiency against ad sales, TACoS measures ad dependency against all sales.
How often should I check it?
Monthly is the right cadence. Weekly TACoS is noisy because organic sales swing day to day, and reacting to that noise causes more damage than ignoring it.
Using it in practice
Pull it monthly. A spreadsheet with three columns, spend, total sales, and the division, is all the tooling this metric needs, the discipline of looking at it is the hard part. If you'd rather not build one, the free TACoS calculator compares two months and shows whether ACoS or the ad share of sales moved it. Set your per-product targets on ACoS (here's how to choose a target ACoS), then let TACoS be the monthly judgment call on whether the strategy behind those targets is working.
The ads side of that equation, the bids, the negatives, the harvesting that ACoS measures, is the part Merch Jar automates with rules you write yourself. 14-day free trial, no credit card.
One number to leave with. If your TACoS has been rising for three straight months on a product that isn't in launch, treat it as the earliest signal you'll get that organic ground is being lost.